

Data analysis of cap-and-trade program investments
California’s cap-and-trade program generates roughly $7-8 billion per year, of which $2-3 billion is rebated to electricity customers in the form of the California Climate Credit while $4-5 billion is deposited into the state’s Greenhouse Gas Reduction Fund (GGRF) to support the state’s climate goals. In this article, we analyze the performance of these investments. We answer the following questions:
When did cap-and-trade auctions start? How much money have they generated?
How big is the annual California Climate Credit? How much do ratepayers receive?
How big is the annual GGRF? Where is the money invested?
How cost-effective are individual GGRF programs?
How cost-effective is the overall GGRF portfolio?
How does GGRF cost-effectiveness compare against best available technology cost estimates?
This article is part of a broader analytical effort related to cap-and-trade. Other articles include: Aligning GGRF with the 2022 Scoping Plan (Sept 2024); Strengths and limitations of California’s cap-and-trade program (Mar 2025); and A clean energy infrastructure plan for the GGRF (Apr 2025). We anticipate further analyses on technology innovation and climate resilience investment opportunities.
For feedback, questions, please email: amanda@netzerocalifornia.org and sam@netzerocalifornia.org.
Note: This post was updated in April 2025 to reflect the latest publicly available data.
* * *
When did cap-and-trade auctions start? How much money have they generated?
Cap-and-trade auctions were first run in 2013. The below figure summarizes the amount of proceeds generated since program inception. The total is roughly $50 billion, which has been split approximately 40%, or $20B, to the California Climate Credit, and 60%, or $30B, deposited into the GGRF.

Source: CARB Auction Proceeds (2024)
How big is the annual California Climate Credit? How much do ratepayers receive?
The California Climate Credit refers to the state’s annual rebate to utility customers based upon the sale of allowances by investor- and publicly-owned utilities (i.e., large-emitting, regulated entities under cap-and-trade). The rebate amount varies in a given year based upon the carbon price and amount of allowances sold. For example, the 2025 credit, which is based upon roughly $2-3 billion in revenue from cap-and-trade auction proceeds, will see PG&E and SCE customers receive $116 and $112, respectively, off of their electric bills. This totals roughly $10/month for customers of the state’s two largest investor-owned utilities. For more information, see: CPUC California Climate Credit.
How big is the annual GGRF? Where is the money invested?
The GGRF refers to a portfolio of climate programs that receive grants based upon the sale of allowances under cap-and-trade. Figure 2 summarizes the total funding – $28.7 billion – that has been appropriated from GGRF to 90 programs administered by 24 state agencies since 2013-14.
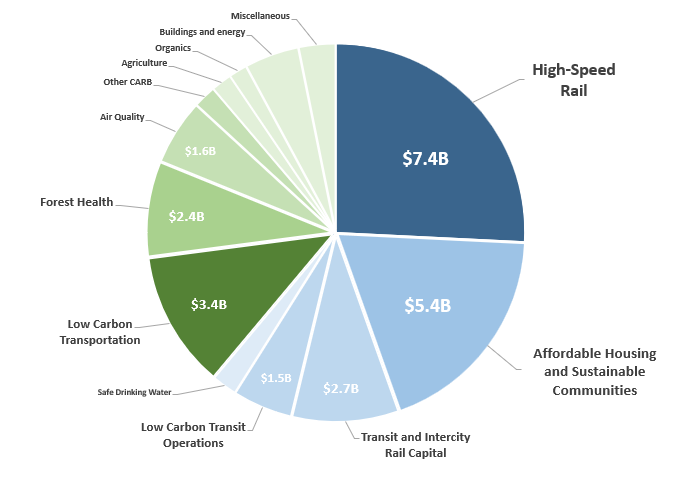
Source: CCI 2024 Mid-Year Data Update and HSR 2025 Project Update.
The blue represents programs that receive annual (or ‘continuous’) appropriations. Established via SB 862, continuous appropriations represent 60% of total appropriations – or $17.5 billion. The main programs that receive continuous appropriations include High-Speed Rail, Affordable Housing and Sustainable Communities, and Transit. Of the total appropriation, $9.1 billion has been implemented to date.
The green represents programs that receive discretionary appropriations, which may change in any given year. Discretionary appropriations represent the remaining 40% of total appropriations – or $11.2 billion. The main programs that receive discretionary appropriations include Low Carbon Transportation, Forest Health, and Community Air Quality. Of the total appropriation, $6.3 billion has been implemented to date.
For more information, see the ‘Appropriations – 2025 Summary’ tab of the core excel spreadsheet.
How cost-effective are individual GGRF programs?
With data on emissions we can estimate GGRF cost-effectiveness ($/ton of carbon reduced). CARB tracks GGRF emissions data as part of its California Climate Investments (CCI) program. The exception is High-Speed Rail, the emissions data for which is estimated by the High-Speed Rail Authority.
Overall, GGRF has reduced 113 million tons of carbon since inception – or about 10 million tons per year. The cost-effectiveness of GGRF programs ranges from roughly $9 to $2,000/ton, with multiple observations above this range.
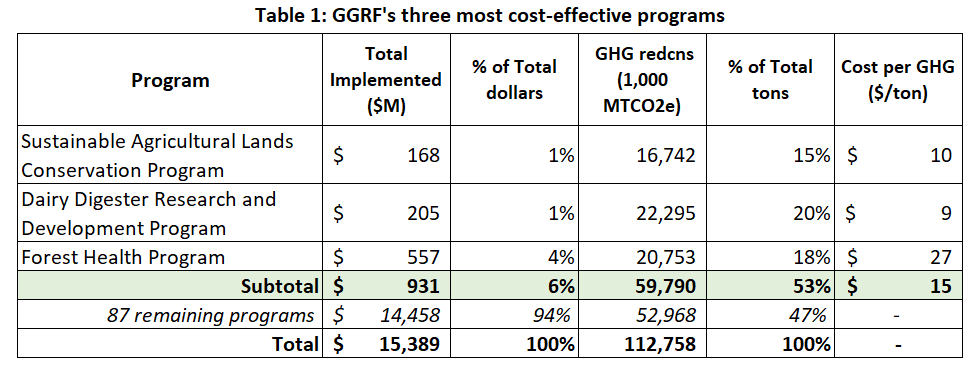
The three most cost-effective programs that have also generated at least 1 million tons of carbon dioxide-equivalent reductions to date include: Sustainable Agricultural Lands Conservation Program (Strategic Growth Council), Dairy Digester Research and Development Program (California Department of Food and Agriculture), and Forest Health Program (California Department of Forestry and Fire Protection). These three programs are responsible for 6% of implemented funding to date and have delivered 53% of the total emissions reductions of the GGRF portfolio (Table 1).
A note on GGRF contribution vs. total project costs
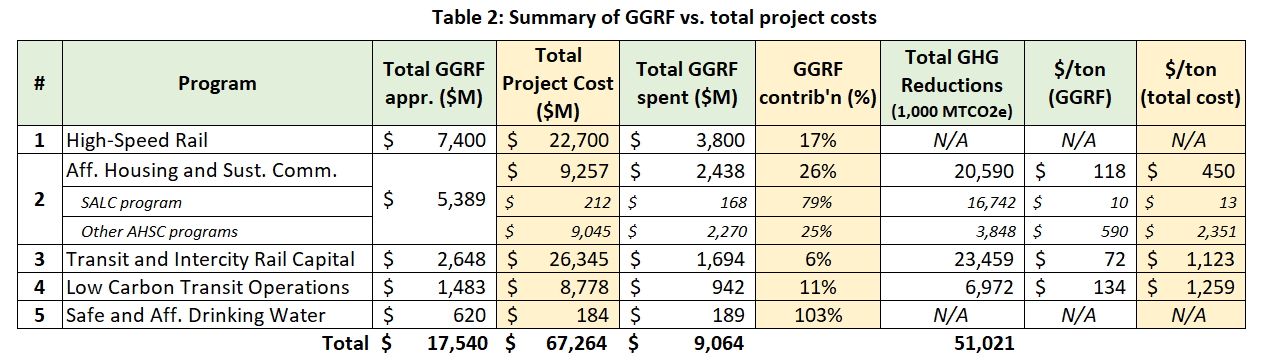
Table 1 calculates cost-effectiveness by dividing total GGRF implemented costs (column 2) by total project GHG reductions (column 4). However, it is important to note that GGRF grants typically cover only a portion of total project costs. For example, the SALC program has implemented $168 million in GGRF funds, but total project costs are $212 million (i.e., GGRF has provided 79% of total funding). Meanwhile, GGRF cost-effectiveness estimates are based upon total project emissions reductions, and not, for example, a proportionate amount equal to the contribution of GGRF.
It is therefore possible to calculate an alternate measure of cost-effectiveness based upon total project costs. We summarize below a broader cross-section of programs which receive continuous appropriations. As expected, a total project cost benchmark shows a reduction in cost-effectiveness. For example, AHSC programs see a $/ton increase from $590 to $2,351, while Transit and Intercity Rail Capital increases from $72/ton to $1,123/ton – both owing to substantial non-GGRF project costs.
We highlight both of these options for perspective, noting that both could be valid. It seems reasonable to adopt the current CCI approach (i.e., $/ton based upon the GGRF contribution only), particularly in cases where GGRF makes a meaningful contribution to total cost, with the implication being that the project would likely not have proceeded without the GGRF investment. However, this argument may not hold to the extent GGRF accounts for a relatively minor (e.g. less than 10% or 20%) share of total project costs. Further analysis could more closely determine the importance of a GGRF contribution to enabling project financing and development compared to alternative options.
For more information, see tabs ‘Table 1’, ‘Table 2’ and ‘CCI Data 2025’ in the core excel spreadsheet. For access to the list of total project costs, click on the “Download the Detailed Dataset” (75 MB): https://www.caclimateinvestments.ca.gov/annual-report.
How cost-effective is the GGRF portfolio as a whole?
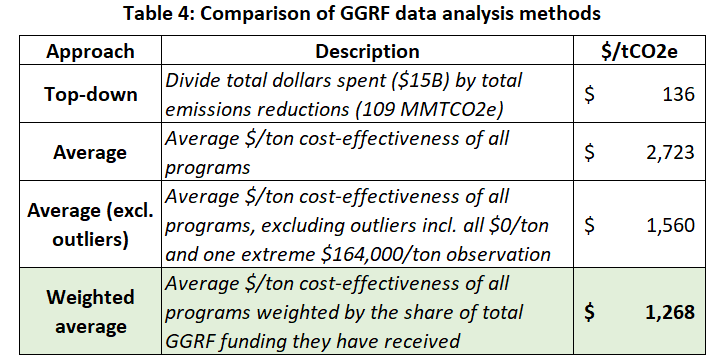
There is more than one approach that could be adopted to evaluate the cost-effectiveness of the GGRF portfolio. We view a weighted average (or expected value) approach as the most appropriate. This approach is detailed further below (Tables 4 and 5). For the sake of completeness, we describe alternative options also.
One approach, which could be thought of as a top-down approach, involves dividing total dollars spent ($15.4B) by total emissions reductions (113 Mt). This results in an estimated cost-effectiveness of $136/ton (Table 3). This is the approach currently adopted as part of the CCI program.
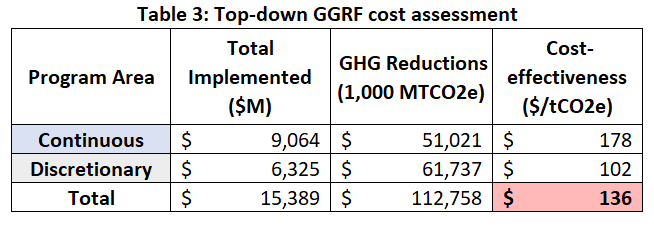
A drawback with the top-down approach, though, is that it is unable to reflect important program-level information. For example, as shown in Table 1, 3 of the 90 programs alone are responsible for the vast majority of emissions reductions (53%) despite implementing only a small portion (6%) of total funding. It is arguable that $136/ton is therefore not a true reflection of the cost-effectiveness of the GGRF portfolio. (Note that a similar observation was made by the Legislative Analyst Office in a 2016 report, available here).
A bottom-up approach can provide a better estimate of cost-effectiveness by incorporating program-level information. A bottom-up approach involves taking an average of the cost-effectiveness across the 90 programs. Without modifying the data in any way, this results in an estimated cost-effectiveness of $2,723/ton. An obvious drawback with this method, though, is that all programs, no matter how minor, are equally weighted. In other words this approach does not account for outliers – including a number of $0/ton estimates (i.e. where no emissions reductions have yet been achieved), which drags down the average, as well as an extreme $164,000/ton estimate, which greatly inflates the average.
We can address this issue in two ways. The first ‘quick and dirty’ method is to manually remove the outliers. The result, now across 52 programs, is an estimated cost-effectiveness of $1,560/ton. (Note that the sizable reduction in programs is because there are 37 programs that are $0/ton).
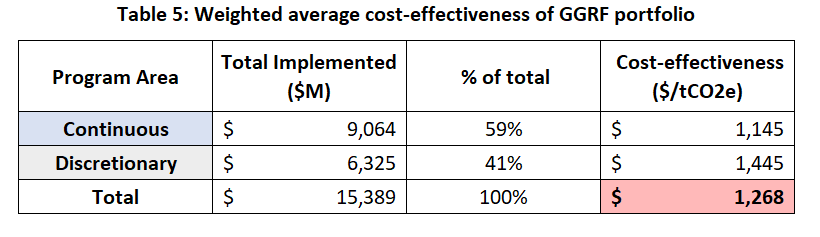
The second more formal approach is to calculate a weighted average across all of the programs. This involves weighting the $/ton estimates for each program by the amount of funding implemented by the program. For the purpose of the overall $/ton estimate, this puts greater emphasis on programs that are key to GGRF and responsible for a larger share of funding, and a lower emphasis on those that are not.
We can show this with a basic example. Two programs funded by GGRF include CARB’s Sustainable Transportation Equity Project (STEP) and CARB’s Clean Vehicle Rebate Project (CVRP). CARB’s STEP program has a cost-effectiveness of $10,489/ton. CARB’s CVRP has a cost-effectiveness of $369/ton. An average of these two results is an estimated cost-effectiveness of ($10,489 + $369) / 2 = $5,429. But is this an accurate reflection of the cost-effectiveness of these two programs, given CARB’s higher-cost program has implemented only $60M worth of projects (0.4% of total GGRF funds), while CARB’s lower-cost program has implemented $1,040M worth of projects (7% of total funds)? Put another way, we should expect a result that is far closer to the CVRP $/ton estimate. A weighted average results in an estimated cost-effectiveness of [($60 * $10,489) + ($1,040 * $369)] / ($60 + $1,040) = $917. (Note another approach to calculate would be [($60/ $1,100) * $10,489] + [($1,040 / $1,100) * $369] = $917.)
We calculate the weighted average cost-effectiveness of the entire GGRF portfolio (90 programs). The result is a cost-effectiveness of $1,740/ton. However, it is clear that the $164,000/ton observation, even though this program receives only 0.1% of GGRF funding, continues to affect this result. By removing this observation alone, for the 89 programs the weighted average cost-effectiveness is $1,268/ton.
We summarize the results of the different methods in Table 4. We view the weighted average result, overall, as providing the most accurate representation of GGRF cost-effectiveness to date (Table 5).
For more information, see tables ‘Table 3’, ‘Table 4’ and ‘Table 5’ in the excel spreadsheet. Also see the ‘High-Speed Rail’ tab for background information on the calculation for HSR cost-effectiveness.
Comparing GGRF against best available cost estimates
We can compare GGRF $/ton data against the best available estimates of how much it should cost to reduce emissions. The table below, from the 2022 Scoping Plan, provides cost estimates for different clean technology needs for achieving economywide net-zero emissions by 2045. The table shows that a majority of mitigation could be achieved for less than $230/ton, well below the $1,268/ton GGRF estimate. The current clearing price of $30/ton can also help address lower cost opportunities.

Although this approach is not a perfect measure – for example, there are many real-world complexities that can increase the cost of emissions reductions compared to model estimates; the table provides a simple, aggregated view of the main mitigation options only – the gap is so large to suggest that at least a review of the GGRF program and its allocations for achieving carbon neutrality would be useful.
* * *